JPMorgan capped off its strong outperformance in 2025 with a big earnings beat in Q3. However, does this strong and steady gainer face... ͏ ͏ ͏ ͏ ͏ ͏ ͏ ͏ ͏ ͏ ͏ ͏ ͏ ͏ ͏ ͏ ͏ ͏ ͏ ͏ ͏ ͏ ͏ ͏ ͏ ͏ ͏ ͏ ͏ ͏ ͏ ͏ ͏ ͏ ͏ ͏ ͏ ͏ ͏ ͏ ͏ ͏ ͏ ͏ ͏ ͏ ͏ ͏ ͏ ͏ ͏ ͏ ͏ ͏ ͏ ͏ ͏ ͏ ͏ ͏ ͏ ͏ ͏ ͏ ͏ ͏ ͏ ͏ ͏ ͏ ͏ ͏ ͏ ͏ ͏ ͏ ͏ ͏ ͏ ͏ ͏ ͏ ͏ ͏ ͏ ͏ ͏ ͏ ͏ ͏ ͏ ͏ ͏ ͏ ͏ ͏ ͏ ͏ ͏ ͏ |
| | Written by Leo Miller 
JPMorgan Chase & Co. (NYSE: JPM) has been one of the market’s most rock-solid performers in 2025. Year-to-date, shares have provided a total return of just over 30%. This has resulted in the stock producing strong and consistent gains after Liberation Day-related market volatility. Since April 14, shares have never gained more than 3% during a single trading session and have never dropped by more than 4%. With the stock seeing significantly more up days than down days in this period, shares have crept higher and higher. On Oct. 14, JPMorgan helped get the Q3 earnings season rolling, releasing its latest financial results. So, what do JPMorgan’s earnings tell investors about the stock’s ability to keep chugging higher? Can JPM continue its brisk ascent, or does the stock face a more difficult road ahead? JPM Crushes Expectations, But Markets Provide No Cigar In Q3, JPM posted revenues of $46.4 billion, equating to nearly 9% growth. This beat estimates of just $44.4 billion, or a growth rate of over 4%. On the bottom line, JPM’s adjusted earnings per share (EPS) reached $5.07, growing by 16% from the prior year. This walloped analyst estimates of just $4.83, or 10.5% growth. Aside from these headline numbers, every part of JPMorgan’s business performed well. Net interest income (NII) continued climbing, rising by 2% to $24.1 billion despite lower interest rates. The company’s investment banking business saw strong fee growth of 16%. Fixed income and equity trading segments grew by 21% and 33%, respectively. This allowed the company’s Markets segment to post its best third quarter ever, with revenue of $9 billion. Furthermore, its Asset & Wealth Management business achieved record revenue of $6.1 billion, growing by 12%. There was nothing not to like about JPMorgan’s results. Despite stellar numbers, markets punished rather than rewarded the company. Shares closed down by approximately 2% after the release, signaling that although the company significantly outperformed Wall Street estimates, market expectations were higher. This makes sense, considering the robust gains the stock has seen in 2025. Overall, this indicates that JPM’s impressive rally is running into a bit of a near-term wall. Analysts Stick With Past Forecasts After JPM’s Results JPMorgan’s earnings didn’t seem to sway opinions among Wall Street analysts much one way or the other. Royal Bank of Canada and Goldman Sachs both reiterated their price targets, which come in at $343 and $366, respectively. Additionally, Morgan Stanley issued a relatively insignificant $2 price target increase, moving its forecasts to $338. While a lack of meaningful price target increases is not ideal, a lack of decreases is also a positive sign for this name. JPMorgan has been a standout stock in 2025. Its 30% total return far exceeds gains seen in the general U.S. banking industry. The KBW Bank ETF (NASDAQ: KBWB), a commonly used barometer of bank stock performance, has returned just 19%. Considering JPMorgan’s strong outperformance, it is good to see that analysts are not indicating that the stock’s rally will reverse. The MarketBeat consensus price target for JPMorgan sits near $319, implying only around 4% upside in shares. However, it is essential to note that analyst price targets are trending in the right direction. For instance, the average target among updates issued since the beginning of September is significantly higher at $341. Furthermore, among the three analysts above who updated their price targets after JPM’s results, the average target is $349. That figure implies very solid upside potential in shares of approximately 14%. Such positive momentum proves that shares can continue their “steady-eddy” gains. However, repeating the 30% rise seen over the past 10 months appears to be a somewhat unrealistic expectation. JPM: A Long-Term Winner Facing Near-Term Valuation Resistance All in all, JPMorgan remains arguably the most well-positioned bank in the United States. Its over $830 billion market capitalization shows its dominance. The figure is more than double that of its next largest competitor, Bank of America (NYSE: BAC), with an approximately $380 billion market cap. Despite indicators pointing to a slowdown in JPM’s rally, the stock remains one of the best ways to play the banking industry long-term. It can continue growing its market share and benefit from the fact that the size of the economic pie keeps increasing in the long run.  Read This Story Online Read This Story Online |  A quiet shift is happening across global markets.
Bitcoin ETFs are drawing record inflows, Fortune 500 companies are adding crypto to their balance sheets, and regulators are laying the groundwork for broader adoption.
That's why we've just released our newest report: "Top 5 Digital Assets Set to Surge Through 2025–2026." 👉 [Access Your Free Report Here] |
| Written by Thomas Hughes 
Snap-on Incorporated (NYSE: SNA) stock trades near the high end of its historical range in 2025, but it can go higher because this premium is well deserved. The high-quality industrial business is well-supported by global demand, generates ample cash flow, and pays a healthy capital return, including dividends, distribution growth, a market-beating yield, and share-reducing buybacks. Regarding the value, trading at 17x its current year outlook may be highly valued relative to its historical norms, but let's be fair. This is well below the S&P 500 average; the yield is more than double; the payout is reliable; and the earnings growth outlook is verging on robust. Assuming the analysts are right—and it's likely the forecasts are too cautious (as has historically been the case)—this stock is trading at approximately 10x its 2030 consensus forecast, suggesting a deep value and that its price could increase by 50% to 70% within a few years. 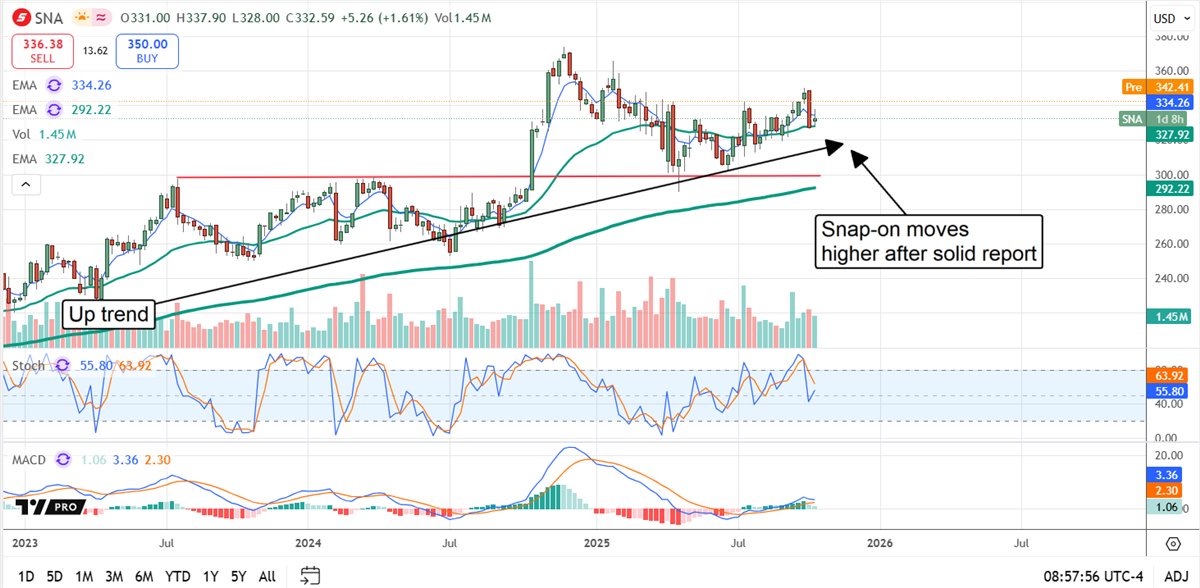
Snap-On Outperforms in Q3, Provides Optimistic Outlook Snap-on had a solid quarter in Q3 with revenue growing by 3% organically, an FX tailwind emerging, and margins strong. The 3.5% top-line gain is slightly better than expected, driven by strength in the Repair segment, which grew by 8.9%. Strength was also seen in the core Snap-on Tools Group, which grew organically by 1%, offset by a slight decline in the Commercial & Industrial and Financial Services segments. Regarding end markets, the company says it is seeing demand from both inside and outside garage settings. The margin news is also solid. The company widened its margins at the gross and operating levels, assisted by foreign exchange translation, leaving operating income and earnings above forecasts. The core operating margin improved by 140 basis points, that’s without the impact of Financial Services, while the net widened by a smaller 90 bps. The takeaway is that adjusted earnings outperformed by a nickel, in alignment with the topline strength, sufficient to sustain and improve the capital return outlook. Snap-on did not provide specific guidance in its report but did offer optimistic commentary. Management says it is well-positioned to sustain its growth, sees numerous opportunities to capitalize on, and is accelerating its capex in Q4 as a result. The goal is to expand the customer base, move into new verticals, and deepen penetration of critical industries. Snap-on’s Capital Return Drives This Uptrend Snap-on’s growth trajectory is critical to the stock price outlook, but ultimately, the impact of that growth on cash flow and capital returns drives the market. This company is a high-yielding stock, paying an annualized distribution of 2.6% as of mid-October. The payout is reliable, as it is less than 50% of the yearly earnings forecast, and the balance sheet is a fortress. Investors may also expect dividend increases in upcoming years. Snap-on has increased for 16 consecutive years and is on track to be included in the Dividend Aristocrats index by the middle of the next decade. In Q3, share buybacks decreased the share count by nearly 1% year-over-year, and for the first nine months of the fiscal year, the reduction was 0.75%. Snap-on Advances, in Alignment With the Prevailing Trend Snap-on’s stock price has struggled to gain traction over the past year, consolidating within a range, but this consolidation is within a larger bull market, setting the stock up to advance in 2026. The post-release action includes a 3% price increase, confirming support at current levels and a likelihood for higher price action by the end of the year. The critical support level is near $330, and a pair of moving averages that includes the 150-day and 30-day EMAs, making it unlikely to be broken. The critical resistance is near $360 and could be reached by late November. In the long term, analysts' trends suggest that this market could exceed the $400 level by mid-2026. Read This Story Online |  While headlines focus on Tesla's car sales, tech analyst Jeff Brown says the real story is Tesla's role in a $25 trillion AI revolution — one that Nvidia's CEO himself has called a "multi-trillion-dollar future industry" — and he's uncovered a little-known stock 168 times smaller than Nvidia that could be positioned to ride this breakthrough. Click here now to see the full report |
| Written by Jordan Chussler 
Since the advent of commercially available electricity, the world’s primary generation source has been coal. And despite natural gas overtaking the combustible black sedimentary rock as the foremost source used in the United States in 2016, coal has remained king globally. That was until the first half of 2025. According to a report published by energy think tank Ember, renewable energy sources collectively contributed 34.3% of all global electricity generated in the first six months of the year compared to coal accounting for 33.1% of all generation. While fossil fuels and the companies producing them continue to play a large part in the global energy landscape, this monumental and historic shift toward clean energy marks a turning point in electricity generation. For investors looking to gain exposure, one ETF provides access to a basket of global renewable energy stocks, and so far this year, the fund has outperformed the S&P 500 by more than 28%. While the U.S. Lags, China and India Forge Ahead With Clean Energy The United States remains heavily reliant upon fossil fuels for electric power production. According to the U.S. Energy Information Agency, in 2024, natural gas led the way with roughly 38% of the total energy production, with crude oil contributing another around 27% and coal adding about 10%. Renewable sources, on the other hand, have been slow to take hold. Last year, biofuels, wind, and solar energy production built on a record 2023 with each source setting a record in 2024. Biofuels production increased 6% year-over-year (YOY), while wind and solar increased by 8% and 25%, respectively. But despite those gains, renewables still lag natural gas, crude oil, and coal by a considerable margin. Abroad, however, the electricity generation landscape tells a different story. The world’s two most populous nations—India and China—have leaned heavily into sustainability projects, with China not only dramatically increasing its use of renewables but simultaneously decreasing its reliance upon fossil fuels. Ember’s report cited how in the first half of 2025, China accounted for 55% of the total global solar generation growth. The United States, for context, accounted for just 14% of the global total. Meanwhile, the Asian nation was also responsible for 82% of wind energy growth while its electricity generation from fossil fuels has begun to plateau. India, for its part, saw solar and wind grow at record paces in the first half of the year, with solar specifically growing by 25% YOY. Ember also stated that in the United States, renewables are failing to keep pace with strong demand growth. That, in particular, is why investors looking to add clean energy exposure to their portfolios should be looking at funds that focus on global companies operating in that space. A Market-Beating Global Renewable Energy ETF As its name suggests, the iShares Global Clean Energy ETF (NASDAQ: ICLN) seeks to track the investment results of an index composed of global equities in the clean energy sector. The fund’s 129 holdings include companies based in Brazil, China, Denmark, Germany, India, Indonesia, Japan, New Zealand, Portugal, South Korea, Spain, the United Kingdom and the United States. While some investors may assume the ETF is entirely leveraged to renewable energy stocks, the fund’s construction paints a much different picture. By industry, its top five allocations are: - Electric utilities: 29.25%
- Renewable electricity: 21.01%
- Heavy electrical equipment: 19.79%
- Semiconductors: 11.46%
- Electrical components and equipment: 10.82%
With the fund’s two top holdings being First Solar (NASDAQ: FSLR) and Bloom Energy (NYSE: BE), it’s no wonder why ICLN—and its nearly 42% YTD gain—has handily outperformed the market in 2025. First Solar is the largest U.S.-based solar panel manufacturer and the company has improved its margins by providing end-of-life photovoltaic recycling operations at each of its facilities. Meanwhile, Bloom Energy designs and manufactures solid oxide fuel cells that independently produce electricity onsite for power generation in AI data centers. That line of business has resulted in shares of BE surging more than 388% this year. The ETF’s relatively low expense ratio of 0.41% is entirely offset by the fund’s dividend, which yields 1.52%, or 25 cents per share annually. On a quarterly basis, ICLN’s dividend payout has increased more than 92% from Dec. 30, 2020, to June 16, 2025, when it made its last distribution. What Wall Street Thinks of ICLN Based on 175 analysts’ ratings issued over the past year covering seven of the companies held in ICLN, or slightly more than 28% of the total portfolio, the fund receives a Moderate Buy rating. Institutional ownership saw more sellers than buyers in the past year. Despite that, inflows of $143 million have exceeded outflows of $114 million over the same period. Short interest stands at an unimposing 3.41% of the float. Investors looking to capitalize on the global shift to renewable energy sources for electric power consumption should consider opening a position. Read This Story Online |  |
|
| |
|
|