
Editor’s Note: Former tech executive and angel investor Jeff Brown — picked Bitcoin before it jumped as high as 52,400%, Tesla before it jumped as high as 2,150%, and Nvidia before it jumped as high as 32,000%. Today, he’ll show you how to claim a stake in Elon Musk’s upcoming IPO – BEFORE the company goes public. Click here to see the details or read more below.
Dear Reader,
Have you heard of Elon Musk’s $1 quadrillion IPO?
If not, click here now because it’s set to be the biggest AI IPO in history…
And you could claim a stake today...
Before the company goes public…
Starting with just $500.
You see, this IPO is a key part of Elon Musk’s secret AI masterplan…
A plan that I believe will unlock the full power of artificial intelligence…
Unleashing what Elon Musk is predicting will be…
A $1 quadrillion new wealth wave.
Just to put that into perspective…
That would be enough to send a check for $2.8 million to every man, woman, and child in America.
That’s how big this opportunity is.
Click here now and I’ll give you all the details.
We have so much to look forward to,
Jeff Brown
Founder & CEO, Brownstone Research
Why PriceSmart’s Discount May Not Last Much Longer
Written by Thomas Hughes. Date Posted: 4/10/2026.

Key Points
- PriceSmart is positioned to grow, drive cash flow, and pay dividends in 2026, outperforming estimates for fiscal Q2.
- Marketshare gains, new stores, and comp-store growth underpin an outlook for double-digit earnings growth over the coming years.
- PriceSmart’s valuation remains below that of its larger membership-club peers, though emerging-market exposure and currency volatility remain key risks.
- Special Report: Have $500? Invest in Elon’s AI Masterplan
PriceSmart (NASDAQ: PSMT) has elevated risk as an emerging-market stock, but it is well positioned and trading at a value relative to its peers, Walmart’s (NASDAQ: WMT) Sam’s Club and Costco (NASDAQ: COST).
These two leading membership club retailers, which trade at much higher valuations, suggest PriceSmart's stock has plenty of upside. Trading at approximately 29x earnings versus Costco’s approximately 50x, the upside potential is significant indeed, and underpinned by its ability to grow.
PriceSmart self-funds its growth and leads in terms of percentage gains. The fiscal Q2 2026 results reflect a 9.7% growth rate, compared with Costco's 9.1% and Walmart's 5.6% during the comparable period.
Looking ahead, PriceSmart expects to sustain its double-digit pace, driven by market share gains, comp-store growth, and new store openings. As of FQ2 2026, the company’s store count increased by 3.7% year-over-year and is expected to increase by nearly 9% by the end of FY2027.
PriceSmart Outperformance Triggers Continuation Signal
PriceSmart has a solid fiscal Q2, with revenue growing by 9.7% to $1.5 billion, outperforming the consensus estimate by 135 basis points.
The gain was driven by a 9.9% increase in merchandise sales, underpinned by a 7.8% increase in net sales and a 2.1% currency tailwind. Comp store sales increased by 7.6% (5.5% adjusted for currency translation), and membership fees grew by 17%, suggesting comp store gains will continue in the upcoming quarters.
Margin news is also good. The company’s improving revenue leverage, better-than-expected traffic, and operational quality led to an accelerated earnings growth. EBITDA, a measure of core profitability, grew by 14.5%, leaving the GAAP EPS at $1.62 or more than a nickel ahead of the consensus. Margins are expected to remain strong in the upcoming quarter, helping trigger a robust market response.
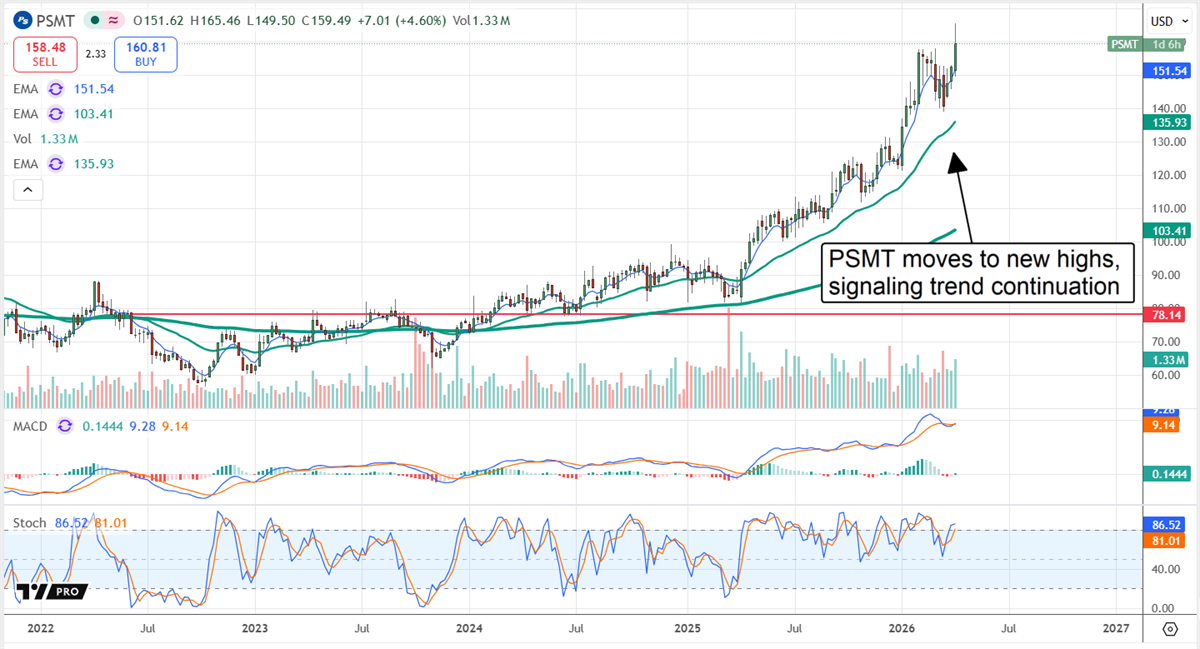
PriceSmart’s stock price surged by more than 2% following the release, taking the market to a new all time high.
The move confirms an uptrend and a bullish Flag Pattern, signaling the continuation of the trend. Targets for this move are based on the magnitude of the Flag’s Pole—approximately $22—putting this market near $175 by mid-year. Higher highs are likely over the longer term due to growth, cash flow, and the ability to return capital.
PriceSmart’s Dividend and Distribution Growth Make It a Buy-and-Hold Investment
PriceSmart isn’t a high-yielding stock, but it is a reliable dividend payer with a track record for aggressive increases.
In early 2026, the yield was less than 1%, mitigated by the low payout ratio and distribution growth compound annual growth rate (CAGR).
The payout ratio is very low, about 20%, leaving room for distribution increases without the double-digit earnings growth pace.
The CAGR is in the low teens and is likely to be sustained, given the payout ratio and earnings growth.
Institutional activity affirms the stock's dividend-paying power and growth outlook, but may provide a headwind for the price action. The group owns more than 80% of the stock and has bought on balance over the trailing-12-month period, sometimes aggressively, but sold on balance in Q1 2026.
With this in play, the price action may struggle to advance and hold gains, but there is a flipside. The fiscal Q2 release affirms this company’s growth outlook and may lead institutions back into accumulation, as similar results have done for other retail companies.
There were no obvious red flags in the reported quarter's balance sheet—only signs that it can continue executing its strategy. Even with a modest decline in cash at the end of fiscal Q2, PriceSmart remains well-capitalized, and gains in current and total assets help offset the decrease.
At the same time, increases in liability were manageable, leaving equity up and leverage at persistently low levels. Long-term debt is less than 0.25x equity, leaving the company nimble and able to raise capital as needed.
The biggest risks this year are rising costs, margin pressures, and FX volatility. Rising costs and margin pressures have, so far, been mitigated, and FX volatility is an uncontrollable influence likely to remain volatile for the foreseeable future.
Financials Are Down Big This Year, but XLF Is Looking Like a Buy-Low Opportunity
Written by Jessica Mitacek. Date Posted: 3/29/2026.
Key Points
- Despite early optimism that President Trump’s second term would fuel financials through deregulation and lower rates, the sector is the worst performer so far in 2026.
- Growth has been stifled by legal hurdles, contracting net interest margins, and a significant 68% drop in mortgage originations compared to pandemic highs.
- The XLF is offering a buy-low opportunity amid new executive orders on lending, AI efficiency gains, and technical indicators suggesting that a potential price reversal is in play.
- Special Report: Have $500? Invest in Elon’s AI Masterplan
If you spoke with market analysts and investment advisors on the eve of President Donald Trump’s second inauguration, you would have been hard-pressed to find anyone who was bearish on financials.
Most experts agreed that banks, insurers, mortgage lenders and other firms in the financials sector would enjoy tailwinds during Trump’s second term. Wall Street viewed the president as an ally on lower rates and looser regulation, factors thought likely to create a fertile environment for companies operating in financial services.
Read this warning immediately (Ad)
Porter Stansberry, founder of one of the world's largest financial research firms, says he's breaking the biggest story of his 26-year career. A famous historian whose books have sold over 45 million copies in 65 languages is warning of a structural shift so large it has only one historical parallel - 1776.
One Stanford economist calls it 'the biggest change ever - bigger than electricity, bigger than the steam engine.' Stansberry outlines the stocks to buy, the stocks to sell, and three money moves to position yourself on the right side of this shift.
Read Porter Stansberry's full breakdown and protect your wealth nowMore than a year into Trump’s second term, however, that hasn’t been the case.
So far in 2026, the sector has been the worst performer among the S&P 500’s 11 sectors, with a year-to-date (YTD) loss exceeding 10%. But, like the well-publicized tech sell-off this year, financials’ weakness presents a buy-low opportunity for investors seeking a favorable entry point. That’s particularly true of the Financial Select Sector SPDR Fund (NYSEARCA: XLF), which has dropped double digits from its all-time high of $56.51 in January.
What’s Been Holding Back Financials
Expectations for further deregulation during Trump’s second term were high. After signing the most significant rollback of banking regulations since the global financial crisis in his first term, Trump was expected to continue easing oversight.
That included potential changes to the Dodd-Frank Wall Street Reform and Consumer Protection Act and efforts to defund the Consumer Financial Protection Bureau (CFPB). Attempts to curtail the CFPB ultimately fell short, as federal judges issued injunctions preventing unilateral action by the White House.
Financial institutions have also been hit by contracting net interest margins (NIM)—the difference between interest earned on loans and investments and interest paid on deposits and debt. With the Federal Reserve maintaining low rates, banks—especially regional lenders—have faced tighter NIMs, which reduces profitability.
The housing market has weighed on the sector as well. Consumer mortgage originations at large banks have fallen nearly 68% from pandemic highs, and rates for 30-year fixed loans are at a YTD high.
Catalysts Are on the Horizon
After trailing the market throughout Q1, there are reasons to believe financials could rebound through the remainder of 2026. In March, Trump signed an executive order loosening certain lending requirements to promote mortgage lending.
Digital asset integration efforts, including the GENIUS Act, could open new sources of transaction revenue. Large banks are also increasingly adopting practical agentic AI applications that can operate autonomously under human oversight, improving efficiency and reducing costs.
With the 10-year Treasury yield curve normalizing, NIM should improve for smaller and regional lenders, allowing banks to benefit from borrowing short-term while lending long-term. At the same time, mortgage rates are expected to stabilize and home-price growth is forecast to moderate, which could improve housing affordability.
For investors looking for exposure without selecting individual winners, the XLF offers broad sector coverage at prices that are currently on sale.
A Basket of Big Banks, Brokerages, Insurers, and Payment Processors
The XLF includes several household names.
Its top-five holdings comprise Berkshire Hathaway (NYSE: BRK.B), JPMorgan Chase (NYSE: JPM), Visa (NYSE: V), Mastercard (NYSE: MA), and Bank of America (NYSE: BAC).
The fund’s portfolio provides an attractive allocation across financial industries, including banks (27.3%), capital markets (25.6%), insurance (24.8%) and diversified financial services (18.4%).
The XLF also pays a dividend with a yield of 1.46%, which more than offsets the ETF’s expense ratio of 0.08%.
With nearly $49 billion in assets under management, the XLF is the world’s largest financials ETF. At a current price around $49.34, the fund is trading roughly 13% below its 52-week high — a discount that may not last long.
Technical Indicators Hint at a Potential Reversal
Despite the XLF trading below both its 50- and 200-day moving averages, some technical signs are bullish. The Relative Strength Index (RSI) on the ETF’s one-year chart bottomed below 30 in mid-March—an indication the XLF was oversold and ripe for a reversal. Since then it has been consolidating and establishing support around the $49 level.
Since the RSI dipped below 30, it has climbed above 38 and is trending higher. When the RSI bottomed, it coincided with a bearish death cross, with the 50-day moving average dipping below the 200-day moving average. That pattern could be short-lived if the RSI continues to improve.
For context, the last time the RSI fell below 30 was last April amid the market’s tariff concerns. The XLF then rallied more than 20% before the end of May. A similar move this year would push shares to about $59.20, establishing a new 52-week high.
This email communication is a sponsored email from Brownstone Research, a third-party advertiser of MarketBeat. Why did I get this email message?.
If you have questions about your subscription, please email MarketBeat's South Dakota based support team at contact@marketbeat.com.
If you would no longer like to receive promotional emails from MarketBeat advertisers, you can unsubscribe or manage your mailing preferences here.
© 2006-2026 MarketBeat Media, LLC.
345 North Reid Place #620, Sioux Falls, South Dakota 57103. United States of America..


